US life expectancy has rebounded from the pandemic-era low, reaching a new record in the most recent year with final national mortality data. The figures below use period life expectancy (based on death rates observed in a given year), reported by the CDC’s National Center for Health Statistics (NCHS).
US life expectancy statistics
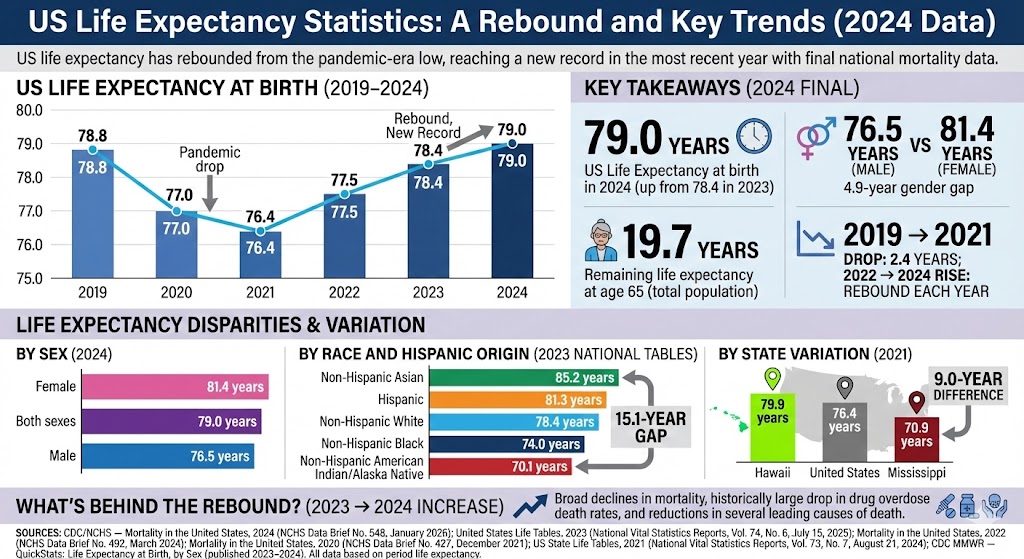
Key takeaways
79.0 years: US life expectancy at birth in 2024 (final), up from 78.4 in 2023.
76.5 vs 81.4 years: 2024 life expectancy at birth for males vs females (a 4.9-year gap).
19.7 years: 2024 remaining life expectancy at age 65 (total population).
2019 → 2021: life expectancy fell from 78.8 to 76.4 (a 2.4-year drop), then rose each year from 2022 through 2024.
Large disparities remain: in 2023 national life tables, life expectancy ranged from 70.1 (non-Hispanic American Indian/Alaska Native) to 85.2 (non-Hispanic Asian).
Latest US life expectancy (2024, final)
In 2024, US life expectancy at birth was 79.0 years. Females averaged 81.4 years and males 76.5 years, narrowing the female–male gap to 4.9 years.
Chart: US life expectancy at birth (2019–2024)
Year
Bar
Life expectancy
2019
78.8 years
2020
77.0 years
2021
76.4 years
2022
77.5 years
2023
78.4 years
2024
79.0 years
Max = 79.0 years. Widths: 2019 99.75%, 2020 97.47%, 2021 96.71%, 2022 98.10%, 2023 99.24%, 2024 100.00%.
Life expectancy by sex (2024)
In 2024, females had a life expectancy at birth of 81.4 years, compared with 76.5 for males.
Chart: Life expectancy at birth by sex (2024)
Group
Bar
Life expectancy
Female
81.4 years
Both sexes
79.0 years
Male
76.5 years
Max = 81.4 years. Widths: Female 100.00%, Both sexes 97.05%, Male 93.98%.
Life expectancy at age 65 (2024)
Life expectancy at age 65 measures remaining years of life at age 65. In 2024, the US average was 19.7 additional years (20.8 for females; 18.4 for males).
Chart: Remaining life expectancy at age 65 by sex (2024)
Group
Bar
Remaining years
Female
20.8 years
Both sexes
19.7 years
Male
18.4 years
Max = 20.8 years. Widths: Female 100.00%, Both sexes 94.71%, Male 88.46%.
Life expectancy by race and Hispanic origin (2023 national life tables)
In the most recent national life tables by race and Hispanic origin (2023), non-Hispanic Asian people had the highest life expectancy at birth (85.2 years). Non-Hispanic American Indian/Alaska Native people had the lowest (70.1 years), a gap of 15.1 years between the highest and lowest groups shown here.
Chart: Life expectancy at birth by race/ethnicity (2023)
Group
Bar
Life expectancy
Non-Hispanic Asian
85.2 years
Hispanic
81.3 years
Non-Hispanic White
78.4 years
Non-Hispanic Black
74.0 years
Non-Hispanic American Indian/Alaska Native
70.1 years
Max = 85.2 years. Widths: Non-Hispanic Asian 100.00%, Hispanic 95.42%, Non-Hispanic White 92.02%, Non-Hispanic Black 86.85%, Non-Hispanic American Indian/Alaska Native 82.28%.
State variation (2021)
Life expectancy varies widely across the US. In 2021 state life tables, Hawaii had the highest life expectancy at birth (79.9 years), while Mississippi had the lowest (70.9 years), a difference of 9.0 years.
Chart: Highest vs lowest state life expectancy at birth (2021)
Area
Bar
Life expectancy
Hawaii
79.9 years
United States
76.4 years
Mississippi
70.9 years
Max = 79.9 years. Widths: Hawaii 100.00%, United States 95.62%, Mississippi 88.74%.
What’s behind the recent rebound?
The CDC reported that the 2023→2024 increase in life expectancy was driven by broad declines in mortality, including a historically large drop in drug overdose death rates and reductions in several leading causes of death.
Sources
CDC/NCHS — Mortality in the United States, 2024 (NCHS Data Brief No. 548, January 2026).
CDC/NCHS — United States Life Tables, 2023 (National Vital Statistics Reports, Vol. 74, No. 6, July 15, 2025).
CDC/NCHS — Mortality in the United States, 2022 (NCHS Data Brief No. 492, March 2024).
CDC/NCHS — Mortality in the United States, 2020 (NCHS Data Brief No. 427, December 2021).
CDC/NCHS — US State Life Tables, 2021 (National Vital Statistics Reports, Vol. 73, No. 7, August 21, 2024).
CDC MMWR — QuickStats: Life Expectancy at Birth, by Sex (published 2023–2024).