Probability of Death by Cause Calculator
Estimate probability of death by cause over a period with an easy-to-use formula-based approach. This article explains what the Probability of Death by Cause Calculator does, how to use it, how the formula works, practical use cases, and important caveats to consider when interpreting results.
What this Probability of Death by Cause Calculator calculator does
The Probability of Death by Cause Calculator estimates the cumulative probability that an individual (or a population unit) will die from a specific cause over a defined number of years, based on a given annual risk and a cause-specific multiplier. It converts an annualized risk into a multi-year probability, showing the chance that the cause will lead to death at least once during the period.
Key features:
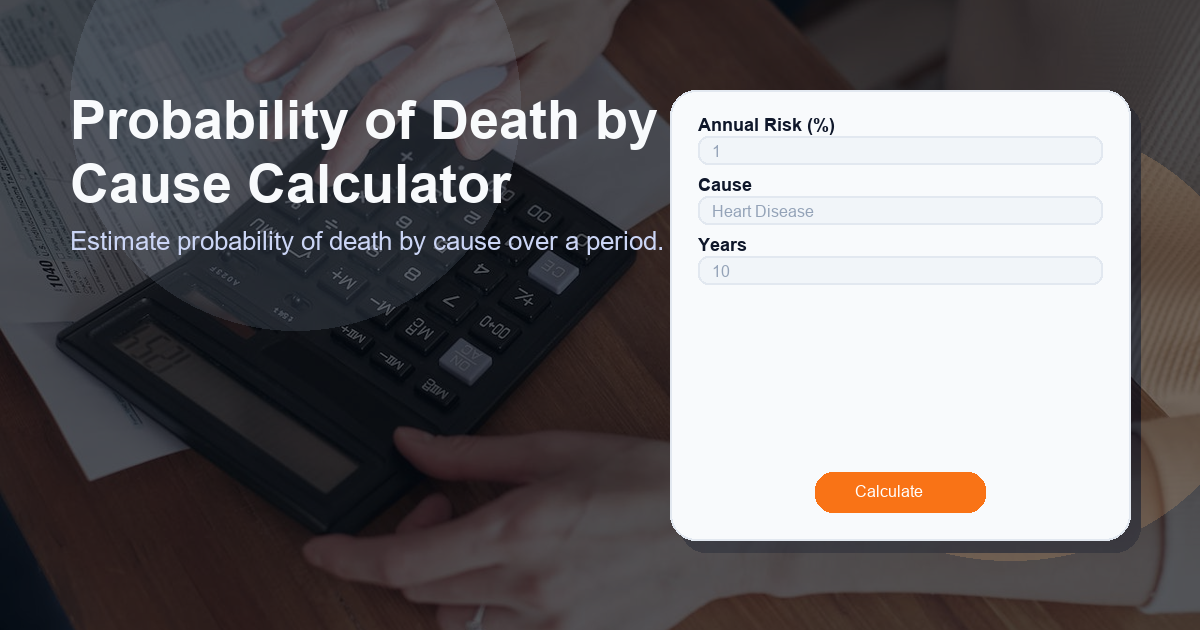
- Inputs: Annual Risk (%), Cause, Years
- Formula used:
(1-Math.pow(1-(annual_risk_percent*cause_factor/100),years))*100 - Result label: Probability of Death by Cause
This approach assumes an annual probability of death from the cause (adjusted by a cause factor) and uses the complement of survival over multiple years to compute the cumulative probability.
How to use the Probability of Death by Cause Calculator calculator
Using the calculator is straightforward. Follow these steps:
- Gather the annual risk (%): This is typically an annual probability (in percent) of death from the cause for the baseline population or demographic of interest. Sources can include public health data, epidemiological studies, or actuarial tables.
- Select the cause: Choose the cause of death you are interested in (e.g., heart disease, cancer, accidents). Each cause can have a cause factor that scales the baseline annual risk to reflect relative risk for a subgroup or exposure.
- Enter the number of years: Specify the period over which you want to estimate the probability (for example, 5, 10, or 30 years).
- Compute: The calculator applies the formula to produce the final estimate labeled Probability of Death by Cause (expressed as a percent).
Example (illustrative):
- Annual Risk = 2.0%
- Cause Factor = 1.5 (e.g., a subgroup with 50% higher relative risk)
- Years = 10
Using the formula: (1-Math.pow(1-(annual_risk_percent*cause_factor/100),years))*100, you would get a result of approximately 26.24%. The result would be displayed as Probability of Death by Cause: 26.24%.
How the Probability of Death by Cause Calculator formula works
The formula used by the calculator is:
(1-Math.pow(1-(annual_risk_percent*cause_factor/100),years))*100Breakdown of terms and steps:
- annual_risk_percent: The baseline annual probability (in percent) of dying from the cause.
- cause_factor: A multiplier that scales the baseline annual risk to represent subgroup differences or exposure effects (for example, smokers vs non-smokers).
- annual risk adjusted (decimal): Convert to decimal by (annual_risk_percent * cause_factor / 100). This is the per-year probability of death from the cause for the specified subgroup.
- Annual survival probability: 1 – adjusted annual risk (the probability of not dying from that cause in a given year).
- Multi-year survival: Raise the annual survival probability to the power of the number of years: Math.pow(annual_survival, years). This assumes independence between years and a constant annual risk.
- At-least-once probability: 1 minus the multi-year survival probability gives the probability of dying from that cause at least once during the period. Multiply by 100 to convert to percent.
Why this makes sense: The formula uses the complement rule. If the chance of surviving each year from that cause is S, then surviving all years is S^n. The chance of not surviving at least once is 1 – S^n.
Use cases for the Probability of Death by Cause Calculator
The calculator is useful across several contexts. Typical use cases include:
- Personal risk estimation: Individuals curious about long-term risk for a specific cause (e.g., someone wanting to understand the cumulative risk of smoking-related death over 20 years).
- Public health planning: Health departments and NGOs can estimate expected case counts or mortality burdens given known annual risks and population sizes.
- Health communication: Communicating long-term risk in a more intuitive way (multi-year probability rather than an annual percentage).
- Insurance and actuarial: Insurers and underwriters may use similar calculations to model survival and pricing decisions (though real-world actuarial practice uses more complex life tables and competing risks).
- Research and epidemiology: Quick scenario modeling to compare the long-term impact of interventions that change annual risk or cause-specific relative risks.
Benefits:
- Easy to interpret: Multi-year probability is often more intuitive than repeated annual percentages.
- Flexible: Works with any cause-specific annual risk and cause factor.
- Fast scenario analysis: Change inputs to see how the probability evolves with different years, risks, or factors.
Other factors to consider when calculating Probability of Death by Cause
While the calculator is a useful approximation, it’s important to understand its limitations and additional factors that affect real-world risk:
- Age and demographic changes: Annual risk often changes with age. The calculator assumes a constant annual risk, which may under- or over-estimate long-term probabilities if risk varies substantially with age.
- Comorbidities and interactions: Co-existing health conditions change risk, and interactions between risks are not modeled here.
- Competing risks: This formula treats the cause in isolation and does not fully account for competing causes of death. In reality, dying from one cause prevents dying from another.
- Time-varying exposures and interventions: If exposure changes (e.g., smoking cessation) or interventions reduce risk over time, a single constant cause factor is insufficient.
- Data quality and source: The result is only as reliable as the annual risk and cause factor inputs. Use reputable sources and consider confidence intervals when possible.
- Statistical uncertainty: Point estimates hide uncertainty. For formal analysis, consider confidence intervals or probabilistic sensitivity analysis.
Practical tip: When using the calculator for planning or decision-making, combine it with age-specific life tables, competing risk models, or expert epidemiological input for the most reliable results.
FAQ
Q: Is the Probability of Death by Cause Calculator precise for individuals?
A: No. The calculator provides an estimate based on a constant annual risk and a cause factor. Individual risk is influenced by age, genetics, lifestyle, and clinical history. Use results as illustrative rather than deterministic.
Q: What is the cause factor and where does it come from?
A: The cause factor scales the baseline annual risk to reflect relative risk for a subgroup or exposure (e.g., smokers vs non-smokers). It can come from epidemiological studies, relative risk estimates, or expert judgment.
Q: Does this calculator account for other causes of death (competing risks)?
A: Not explicitly. The formula models one cause in isolation. For analyses that need competing risks, use cause-specific mortality models or multi-state life tables.
Q: How do I choose a reasonable annual risk percent?
A: Use published mortality rates, national health statistics, cohort studies, or actuarial tables for the population and cause of interest. Ensure the risk matches the same demographic group you’re modeling.
Q: Can I use the calculator to compare interventions (e.g., risk reduction)?
A: Yes. You can model scenarios by changing the annual risk or cause factor to reflect an intervention and compare the resulting multi-year probabilities. Remember to account for time-varying effects if interventions change risk over time.