Global mortality is typically reported as (1) total deaths per year, (2) the crude death rate (deaths per 1,000 people), and (3) leading causes of death. The latest complete WHO cause-of-death rankings are for 2021, while global demographic series (like crude death rate) extend through 2023.
global death statistics
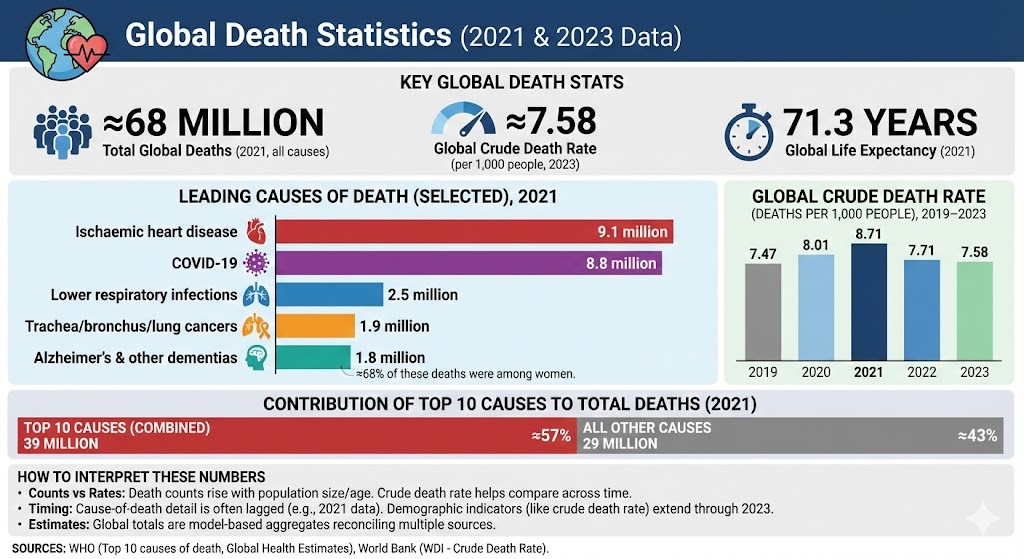
Key global death stats
~68 million people died worldwide in 2021 (all causes).
Top 10 causes of death accounted for ~39 million deaths in 2021 (about 57% of all deaths).
Ischaemic heart disease (IHD) caused ~9.1 million deaths in 2021 (about 13% of global deaths).
COVID-19 caused ~8.8 million deaths in 2021 (directly).
Lower respiratory infections caused ~2.5 million deaths in 2021.
Trachea/bronchus/lung cancers caused ~1.9 million deaths in 2021.
Alzheimer’s disease and other dementias caused ~1.8 million deaths in 2021; ~68% of these deaths were among women.
Global life expectancy was about 71.3 years in 2021.
Global crude death rate was ~7.58 deaths per 1,000 people in 2023 (World Bank WDI series).
Chart: Leading causes of death (selected), 2021
Label
Bar
Value
Ischaemic heart disease
9.1 million
COVID-19
8.8 million
Lower respiratory infections
2.5 million
Trachea/bronchus/lung cancers
1.9 million
Alzheimer’s & other dementias
1.8 million
Max = 9.1 million deaths. Widths: Ischaemic heart disease 100.00%, COVID-19 96.70%, Lower respiratory infections 27.47%, Trachea/bronchus/lung cancers 20.88%, Alzheimer’s & other dementias 19.78%.
Chart: Global crude death rate (deaths per 1,000 people), 2019–2023
Label
Bar
Value
2019
7.47
2020
8.01
2021
8.71
2022
7.71
2023
7.58
Max = 8.71 deaths per 1,000 people. Widths: 2019 85.72%, 2020 91.95%, 2021 100.00%, 2022 88.46%, 2023 86.98%.
Chart: How much do the top 10 causes contribute to total deaths? (2021)
Label
Bar
Value
Top 10 causes (combined)
39 million
All other causes
29 million
Max = 39 million deaths. Widths: Top 10 causes (combined) 100.00%, All other causes 74.36%.
How to interpret these numbers
Counts vs rates: Death counts rise/fall with population size and age structure. The crude death rate (deaths per 1,000) helps compare across time.
Timing: Cause-of-death detail is commonly released with a lag. WHO’s latest global cause rankings are for 2021, while demographic indicators (like crude death rate) extend through 2023.
Estimates: Global totals are model-based aggregates that reconcile multiple sources (civil registration, surveys, and other data).
Sources
WHO — The top 10 causes of death (updated 7 Aug 2024): https://www.who.int/news-room/fact-sheets/detail/the-top-10-causes-of-death
WHO — Global Health Estimates (life expectancy & leading causes): https://www.who.int/data/gho/data/themes/mortality-and-global-health-estimates
World Bank (WDI) — Death rate, crude (per 1,000 people): https://data.worldbank.org/indicator/SP.DYN.CDRT.IN