The average age of death is often reported as the mean age at death: the average age of people who died in a given place and year.
It’s easy to understand, but it can shift quickly if a country has more deaths at younger ages (for example, infectious disease outbreaks, violence, road injuries) or more deaths at older ages (for example, more chronic disease in an aging population).
average age of death statistics
Key average age of death stats (global)
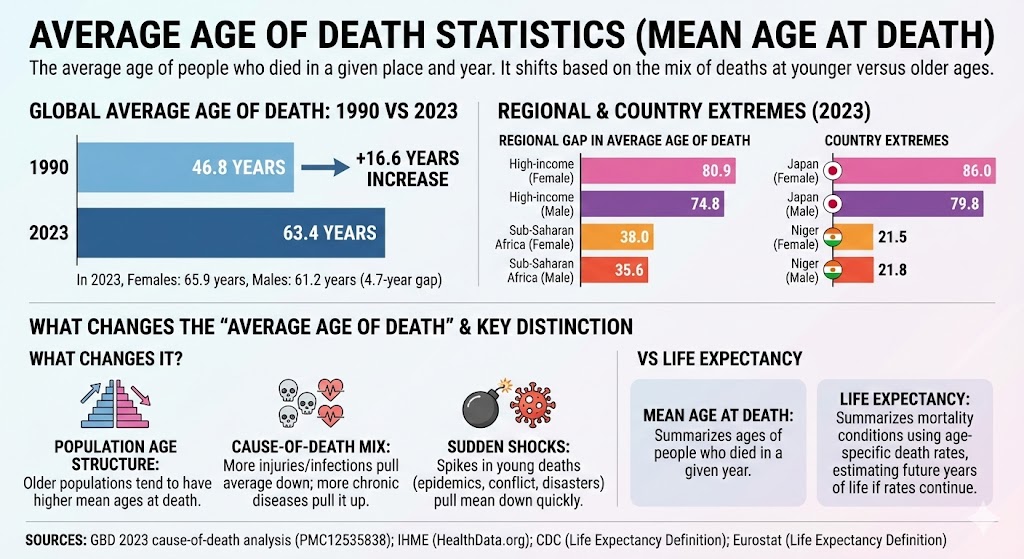
The global mean age at death increased from 46.8 years (1990) to 63.4 years (2023).
In 2023, the global mean age at death was 61.2 for males and 65.9 for females.
From 1990 to 2023, the mean age at death rose by +16.6 years globally (46.8 → 63.4).
In 2023, females died at an average of 4.7 years older than males globally (65.9 vs 61.2).
Global average age of death: 1990 vs 2023
Year
Bar
Value (years)
1990
46.8
2023
63.4
Max = 63.4 years. Widths: 1990 73.82%, 2023 100.00%.
Regional gap in average age of death (2023)
In 2023, the highest all-cause mean age at death was recorded in the high-income super-region, while the lowest was in sub-Saharan Africa.
Region / Sex
Bar
Value (years)
High-income (Female)
80.9
High-income (Male)
74.8
Sub-Saharan Africa (Female)
38.0
Sub-Saharan Africa (Male)
35.6
Max = 80.9 years. Widths: High-income (Female) 100.00%, High-income (Male) 92.46%, Sub-Saharan Africa (Female) 46.97%, Sub-Saharan Africa (Male) 44.00%.
Country extremes in average age of death (2023)
In 2023, Japan recorded the highest mean age at death globally for both females and males, while Niger recorded the lowest.
Country / Sex
Bar
Value (years)
Japan (Female)
86.0
Japan (Male)
79.8
Niger (Female)
21.5
Niger (Male)
21.8
Max = 86.0 years. Widths: Japan (Female) 100.00%, Japan (Male) 92.79%, Niger (Female) 25.00%, Niger (Male) 25.35%.
What changes the “average age of death” the most?
Population age structure: Countries with older populations tend to have higher mean ages at death (even if health systems are similar).
Cause-of-death mix: More deaths from injuries and infections usually pulls the average younger; more deaths from chronic diseases at late ages pushes it older.
Sudden shocks: A spike in deaths at younger ages (epidemics, conflict, disasters) can pull the mean down quickly.
Average age of death vs life expectancy
Mean age at death summarizes the ages of people who died in a given year. Life expectancy summarizes mortality conditions using age-specific death rates, estimating the average number of years a person at a given age can expect to live if those rates continued.
Sources
GBD 2023 cause-of-death analysis (mean age at death trends, regional and country extremes, and methodology): https://pmc.ncbi.nlm.nih.gov/articles/PMC12535838/
IHME (HealthData.org) library page for the GBD 2023 cause-of-death study: https://www.healthdata.org/research-analysis/library/global-burden-292-causes-death-204-countries-and-territories-and-660