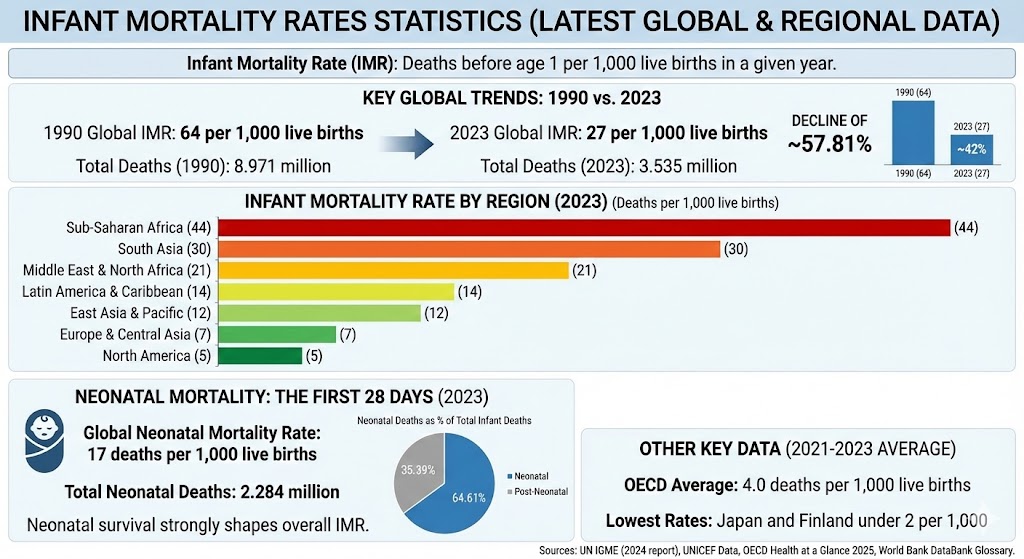
Infant mortality rate (IMR) measures the number of deaths before age 1 per 1,000 live births in a given year.
infant mortality rates statistics
Key infant mortality rate statistics
Global infant mortality rate (2023): 27 deaths per 1,000 live births.
Global infant mortality rate (1990): 64 deaths per 1,000 live births (a decline of about 57.81% from 1990 to 2023).
Estimated infant deaths worldwide (2023): 3.535 million (3,535 thousand).
Estimated infant deaths worldwide (1990): 8.971 million (8,971 thousand).
Sub-Saharan Africa IMR (2023): 44 deaths per 1,000 live births.
South Asia IMR (2023): 30 deaths per 1,000 live births.
Middle East & North Africa IMR (2023): 21 deaths per 1,000 live births.
Latin America & Caribbean IMR (2023): 14 deaths per 1,000 live births.
East Asia & Pacific IMR (2023): 12 deaths per 1,000 live births.
Europe & Central Asia IMR (2023): 7 deaths per 1,000 live births.
North America IMR (2023): 5 deaths per 1,000 live births.
Western Europe IMR (2023): 3 deaths per 1,000 live births.
Global neonatal mortality rate (2023): 17 deaths per 1,000 live births; 2.284 million neonatal deaths (2,284 thousand).
Neonatal deaths were about 64.61% of all infant deaths in 2023 (2.284 million out of 3.535 million).
OECD average (2021–2023): 4.0 infant deaths per 1,000 live births; Japan and Finland were under 2 per 1,000 (2021–2023 average).
Infant mortality rate by region (2023)
Rates vary widely by region, from 44 deaths per 1,000 in Sub-Saharan Africa to 5 in North America (2023).
Region
Bar
IMR (deaths per 1,000)
Sub-Saharan Africa
44
South Asia
30
Middle East & North Africa
21
Latin America & Caribbean
14
East Asia & Pacific
12
Europe & Central Asia
7
North America
5
Max = 44. Widths: Sub-Saharan Africa 100.00%, South Asia 68.18%, Middle East & North Africa 47.73%, Latin America & Caribbean 31.82%, East Asia & Pacific 27.27%, Europe & Central Asia 15.91%, North America 11.36%.
Global infant mortality rate: 1990 vs 2023
Year
Bar
IMR (deaths per 1,000)
1990
64
2023
27
Max = 64. Widths: 1990 100.00%, 2023 42.19%.
Why neonatal deaths matter for infant mortality
Because the neonatal period (the first 28 days) is the highest-risk window, neonatal survival strongly shapes the overall infant mortality rate. In 2023, the global neonatal mortality rate was 17 deaths per 1,000 live births, with about 2.284 million neonatal deaths.
Sources
UN IGME (UNICEF/WHO/World Bank/UN DESA): Levels & Trends in Child Mortality (2024 report; 2023 estimates). https://data.unicef.org/wp-content/uploads/2025/03/UNIGME-2024-Child-Mortality-Report_28-March.pdf
OECD: Health at a Glance 2025 — Maternal and infant mortality. https://www.oecd.org/en/publications/2025/11/health-at-a-glance-2025_a894f72e/full-report/maternal-and-infant-mortality_4379b33b.html
World Bank DataBank Glossary (definition): SP.DYN.IMRT.IN. https://databank.worldbank.org/metadataglossary/world-development-indicators/series/SP.DYN.IMRT.IN