Car Accident Death Statistics

Written by: Associate Editor
Published on:

Car accidents (road traffic crashes) remain one of the world’s biggest preventable causes of death. The latest global estimates put annual road traffic deaths at about 1.19 million, with tens of millions more people injured each year.

car accident death statistics

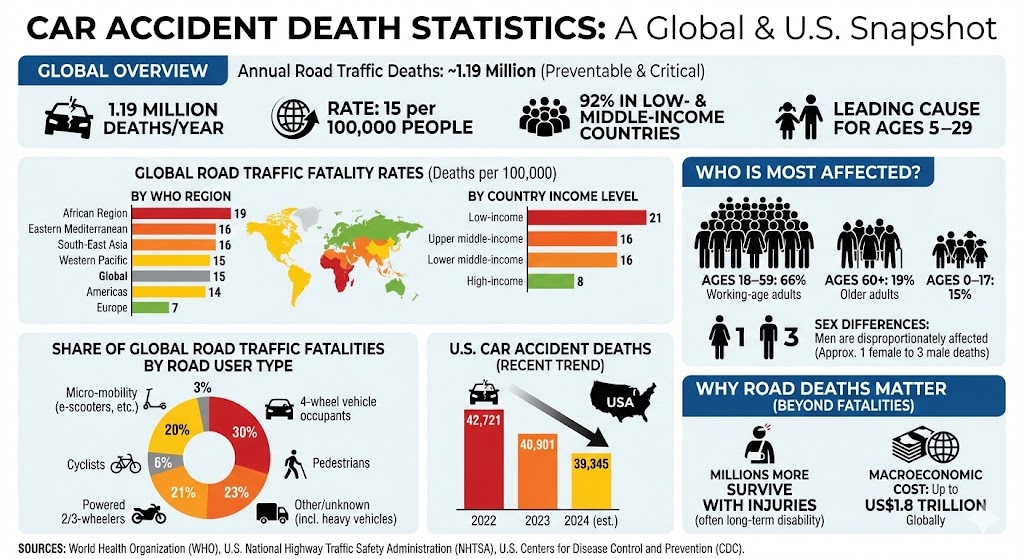
Key car accident death facts (global)

  • ~1.19 million people die in road traffic crashes each year (latest WHO estimate, for 2021).
  • The global road traffic death rate is about 15 deaths per 100,000 people.
  • 92% of road traffic deaths occur in low- and middle-income countries.
  • Road injury is a leading cause of death for children and young people ages 5–29.
  • By road user type, the largest shares of deaths are among 4-wheel vehicle occupants, pedestrians, and powered 2/3-wheeler users.

Road traffic fatality rate by WHO region (deaths per 100,000)

LabelBarValue
African Region
 
19
Eastern Mediterranean
 
16
South-East Asia
 
16
Western Pacific
 
15
Global
 
15
Americas
 
14
Europe
 
7

Max = 19 deaths per 100,000. Widths: African Region 100.00%, Eastern Mediterranean 84.21%, South-East Asia 84.21%, Western Pacific 78.95%, Global 78.95%, Americas 73.68%, Europe 36.84%.

Fatality rate by country income level (deaths per 100,000)

LabelBarValue
Low-income
 
21
Upper middle-income
 
16
Lower middle-income
 
16
High-income
 
8

Max = 21 deaths per 100,000. Widths: Low-income 100.00%, Upper middle-income 76.19%, Lower middle-income 76.19%, High-income 38.10%.

Share of global road traffic fatalities by road user type

LabelBarValue
4-wheel vehicle occupants
 
30%
Pedestrians
 
23%
Powered 2/3-wheelers
 
21%
Other/unknown (incl. heavy vehicles)
 
20%
Cyclists
 
6%
Micro-mobility (e-scooters, etc.)
 
3%

Max = 30%. Widths: 4-wheel vehicle occupants 100.00%, Pedestrians 76.67%, Powered 2/3-wheelers 70.00%, Other/unknown (incl. heavy vehicles) 66.67%, Cyclists 20.00%, Micro-mobility (e-scooters, etc.) 10.00%.

Who is most affected?

  • Working-age adults: About 66% of road traffic deaths are among people ages 18–59.
  • Older adults: About 19% of deaths are among people ages 60+.
  • Sex differences: Men are disproportionately affected (overall female-to-male fatality ratio reported as about 1 to 3).

Estimated share of road traffic deaths by broad age group

LabelBarValue
Ages 18–59
 
66%
Ages 60+
 
19%
Ages 0–17 (remainder)
 
15%

Max = 66%. Widths: Ages 18–59 100.00%, Ages 60+ 28.79%, Ages 0–17 (remainder) 22.73%.

U.S. car accident deaths (recent trend)

In the United States, traffic fatalities have declined for two consecutive years after peaking earlier in the decade. Final federal figures show 40,901 deaths in 2023, down from 42,721 in 2022. Preliminary estimates put 2024 deaths at about 39,345.

U.S. motor vehicle traffic fatalities

LabelBarValue
2022
 
42,721
2023
 
40,901
2024 (est.)
 
39,345

Max = 42,721. Widths: 2022 100.00%, 2023 95.74%, 2024 (est.) 92.10%.

Why road deaths matter (beyond fatalities)

  • For every death, many more people survive with injuries—often with long-term disability.
  • Some estimates put the macroeconomic cost of road traffic injuries at up to US$1.8 trillion globally.

Sources (for the figures above)

  • World Health Organization (WHO): Road traffic injuries (fact sheet) and Global status report on road safety 2023.
  • U.S. National Highway Traffic Safety Administration (NHTSA): Final 2023 and early 2024 traffic fatality estimates.
  • U.S. Centers for Disease Control and Prevention (CDC): Global Road Safety overview.